# Debug
To debug the most immediate is to add console.log(obj) or console.log(JSON.stringify(obj)) commands in the source code to inspect the values of variables at specific points.
First there is more to console than just .log().
This section introduces the the Chrome debugger together with VS Code.
# Procedure 1
- Install VS Code extension Debugger for Chrome.
- Add
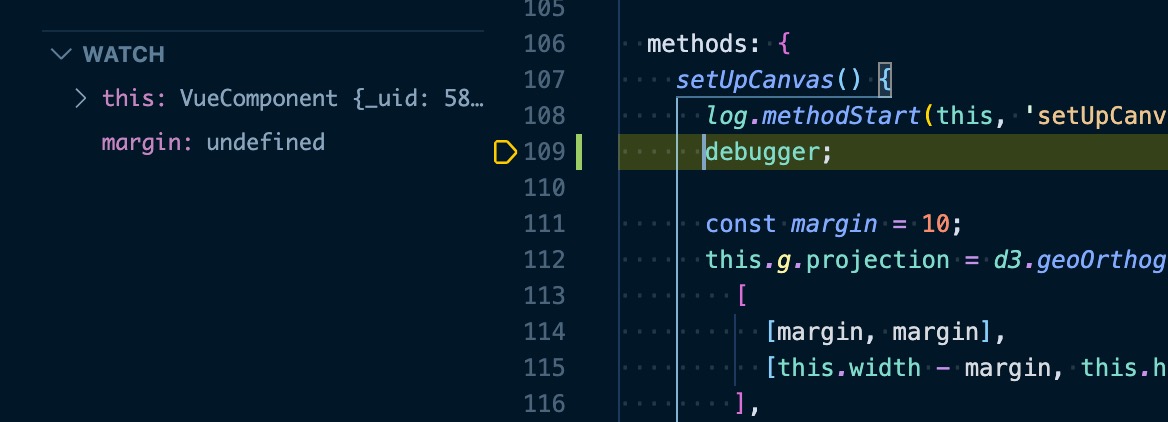
debuggerkeyword in the source code where you want to pause the execution. - Launch command
yarn dev-debug-[f](wherefisvforvuetifyorbforbootstrap) - Open Chrome to
http://localhost:3000 - Open the Chrome console (Win: F12, macOS: Cmd+Alt+J)
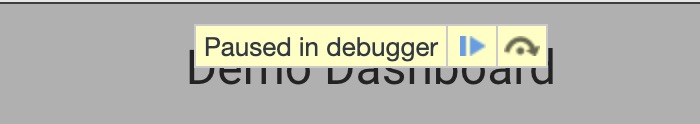
Upon page load, execution will pause in the Chrome debugger.
From there you can:
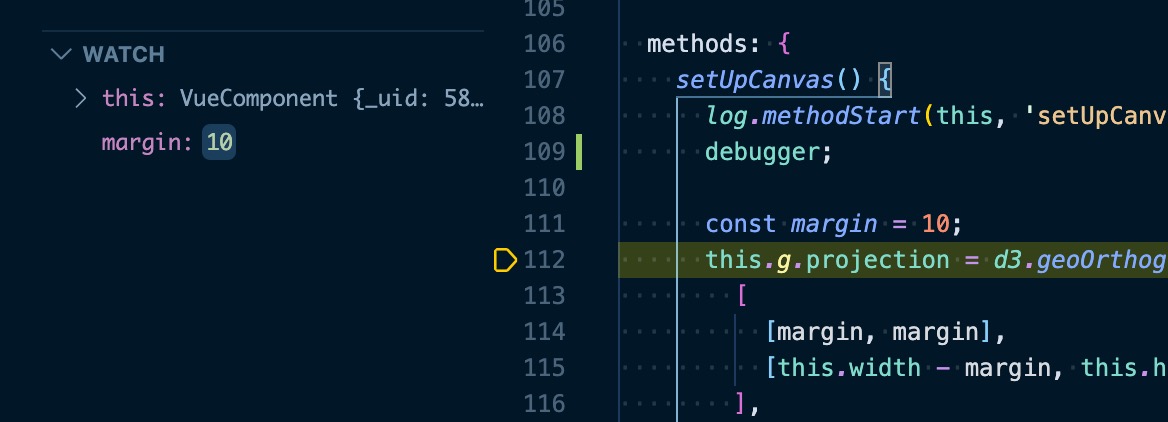
- Inspect variables
- Interrupt execution
- Execute instructions step by step
- Add breakpoints
- Resume execution
To know how see the Chrome debugger doc.
# Procedure 2
Alternatively replace step-4 in Procedure 1 by:
- Add this launch.json file in folder vscode
- Launch VS Code debugger "client: chrome"
This will open a new Chrome window to http://localhost:3000.
Execution will pause both in Chrome and VSCode debugger.
From there you can use either debugger.
WARNING
The VS Code debugger does not work (well) for .vue files.
Execution stops in built files (not source) and breakpoints cannot be set anywhere.
So stick to Procedure 1, or extract the .js part from .vue files e.g. tab-bitcoin-plot.vue
# Webpack
To inspect the webpack config produced by Nuxt:
yarn dump-conf-[f] # [f] = b or v for resp. bootstrap or vuetify
This will dump it in file nuxt-webpack-config-dump.json.
← Phases